In this guide, we delve deep into the Burndown chart. An essential tool in JIRA for tracking “estimated work remaining" versus “work completed". This chart helps you asses whether your team is on track to meet sprint goals. Primarily, Burndown charts apply to Scrum boards, although you can configure a Kanban project to include a Scrum board along with a Burndown chart (will explore this oddity at the end).
We've broken this guide down into the following sections:
– An Introduction to Burndown Charts
– Configuration: items that influence how your chart displays data
– The Different Tracking Methods
A Burndown chart provides a visual representation of the remaining work in a sprint. It compares the estimated effort against the actual progress, helping teams stay on track and make necessary adjustments.
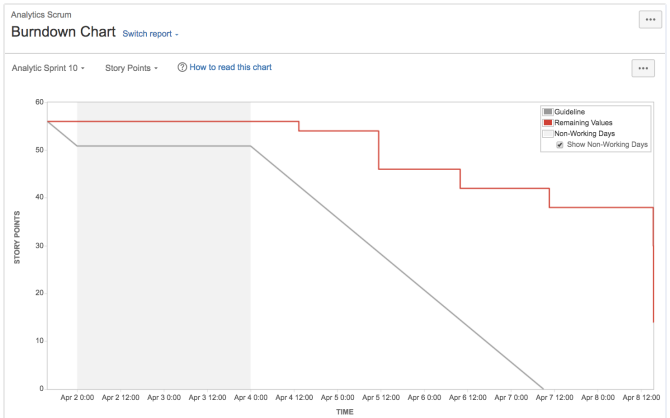
This chart acts as both a diagnostic tool and a motivational dashboard. The primary benefits being:
Tracking Progress: By showing the real-time status of remaining work, the chart helps the team gauge how well they are sticking to their plan. The slope of the burndown line can indicate whether they’re behind or ahead of schedule.
Capacity Management: Understanding your team’s capacity over several sprints helps in better planning future sprints. Too steep a line indicates overestimation, whereas a very shallow line may mean the team is underutilized.
Early Identification of Roadblocks: If the line flattens or rises at any point, it signals potential issues. Such trends enable you to take corrective measures before the sprint deadline.
Team Motivation: Seeing visual progress can foster a sense of accomplishment and keep the team motivated. On the flip side, if they’re falling behind, it serves as an immediate wake-up call to reassess priorities and workloads.
In Jira this chart can be configured to track your burndown rate in 1 of 4 ways
Thus you can select to display the burndown based on these 4 tracking options:
We're going to cover how to configure the burndown chart for each of these metrics. We'll also go through how JIRA configuration elements interact to display the estimated and actual work. We look at these configuration items next.
There are various Jira settings and project configuration items that will influence how you capture Jira data and how Jira uses that data to display the burndown chart. The first aspect of this is the Scrum board configuration.
To generate a burndown chart, you must first create a Scrum board. Think of it in terms of 3 layers. You have your project full of work items (Jira issues). Then you layer on a Scrum board that filters and focuses only on the work items you're interested in. Then the burndown chart lies on top of this using the data picked out by the Scrum board.
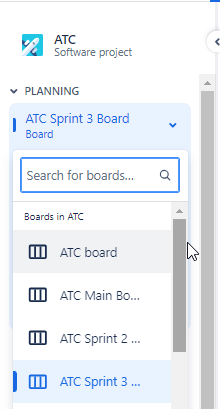
You'll either want to select an existing Scrum board
Or you'll want to create a new Scrum board
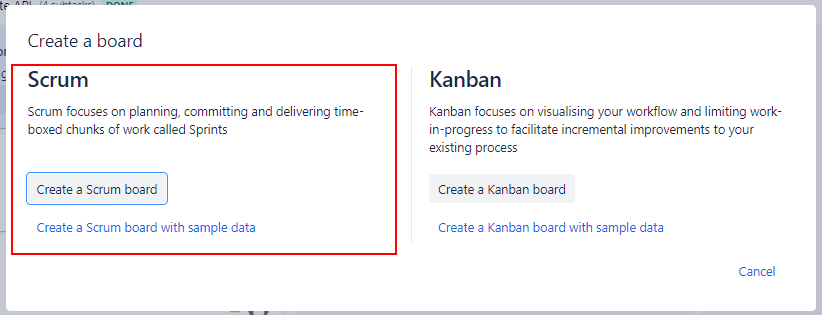
Once you have your scrum board you'll need to configure that Scrum board correctly.
There are several Board Configuration items that will have an impact on your chart.
Comment
Filter Query: This query determines what data is used to create the burndown chart. If you stick with the default query used when creating the board then you see a filter that just selects issues from the current project.
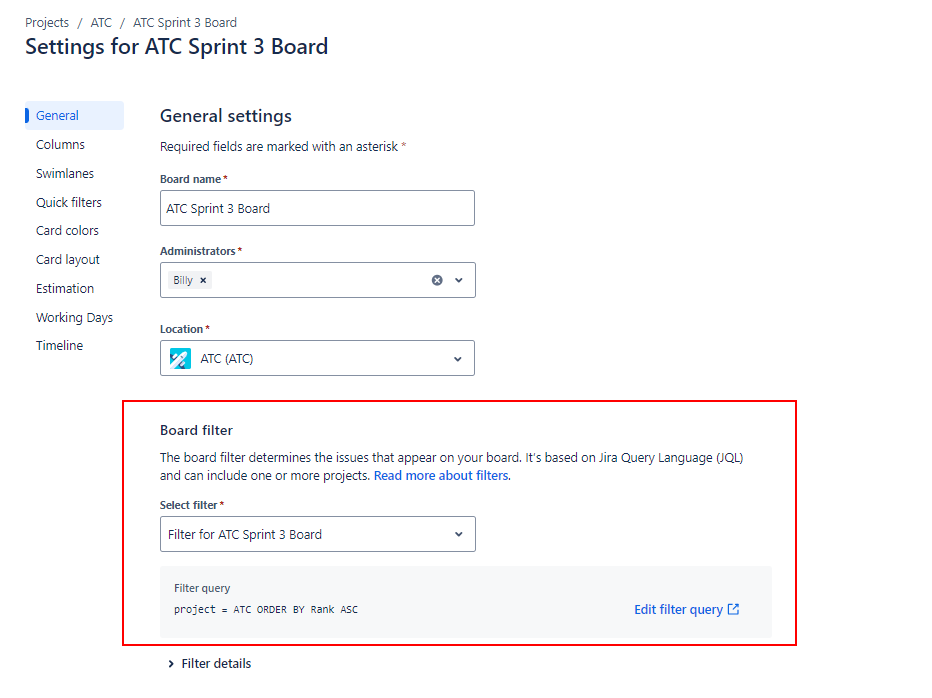
If you want to be a bit more focused then you could modify the filter by clicking on the “Edit Filter Query" link:

And then enter a query that's a bit more specific. For example added the clause issueType = Story to only show stories on your board AND thus only use Stories for the burndown chart.

Don't forget to save this filter for it to take affect on your board.
Columns and Statuses: Ensure the board columns are correctly mapped to statuses (To Do, In Progress, Done). The burndown chart relies on these statuses to track progress.
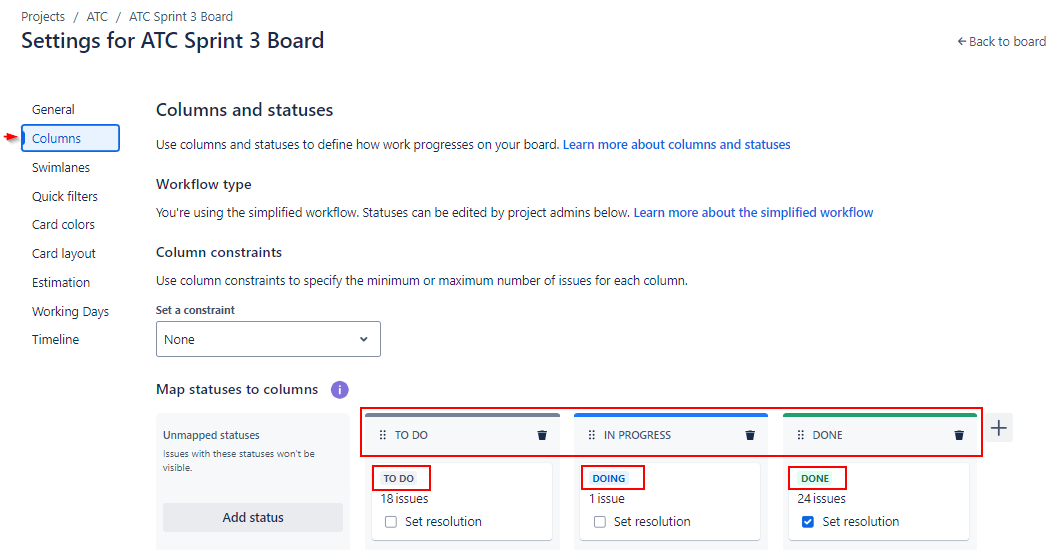
What's important (for a number of the burndown chart types e.g. Story points) is that the burndown value is updated when an 'issue' transitions to a DONE state. So making sure your columns capture that transition is important. The burndown value will ONLY be updated when you drag a card to a column that is mapped to the “DONE" status.
Estimation Settings: This is where all the fun starts.
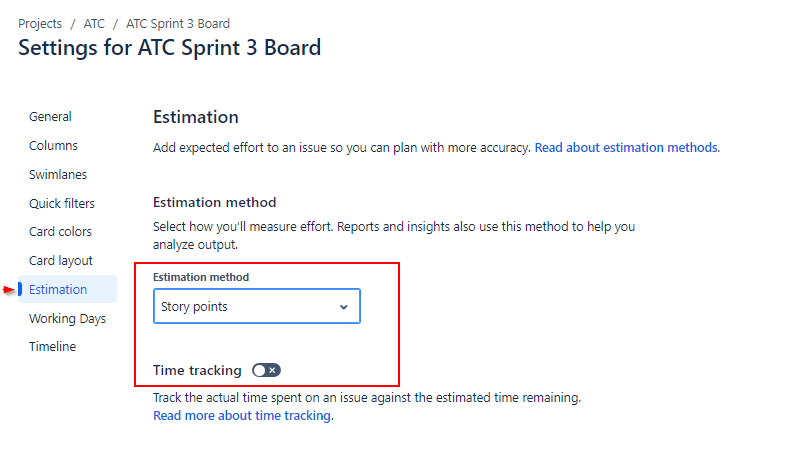
You'll need to select the metric for tracking. You have four options:
The thing is, in the Jira UI it doesn't quite look like you have 4 options. What you need to do is think of this “Original Time Estimate" option has having 'two' options:
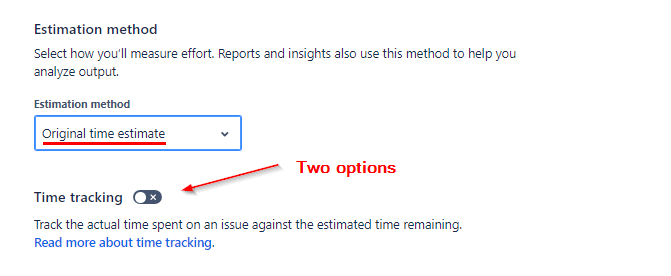
Dont' worry, we're going to explain this in a moment.
The other project configuration elements you need to know about are:
JIRA uses status categories (To Do, In Progress, Done) to track work. Issues in the “Done" category are considered completed. These issues, in a “Done" status category, are the issues used to calculate a burndown step.
When you create your issue 'Statuses' they will belong to one of three inbuilt Jira categories.
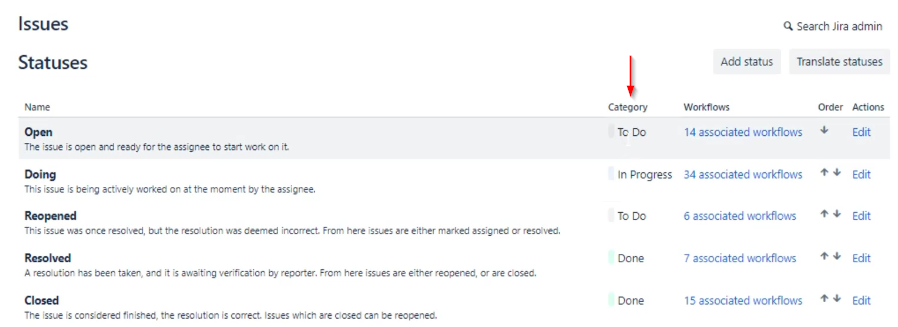
It's these three categories that are used to categorise the issues in the Backlog page (and hence the calculation of the values used for the chart).

Note the grey, blue and green !! These colours tell us the 'Category' that the status is in. A status can ONLY reside in one of the following three categories:
– Grey = not yet started
– Blue = in progress
– Green = done
Whatever, and however many, status values you have, they will belong to ONLY one of these three categories.
So let's say you have an issue that is in a status that is in the “In Progress" category. If this issues transitions to a new status values that is in the “Done" category. It's point in time, when an issue transitions from an “In Progress" category to a “Done" category that Jira adds to the burndown value.
Only certain “Issue Types" (e.g. Stories) can be used to track the effort for the burndown report. A “Story" has a “Story Point" value against it. By default Issue Types like Defects or Bugs don't have story points against them. I guess the key is in the title – “Story Points“. So you may find you can't add “Story Point" estimates to issue types like Bugs, Tasks, etc.

If you find you can't update values for Bugs, Tasks, etc then you'll need to ensure the appropriate fields (e.g., “Story Points" in Company Managed projects or “Story Point Estimates" in Team managed projects) are enabled for the issue types you want to track. This is configured under Settings > Issues > Fields > Custom Fields.

Then once you've clicked on “Context" you'll be able to add other “Issues Types" to the context so that you can track “Story Points" against those issue types.
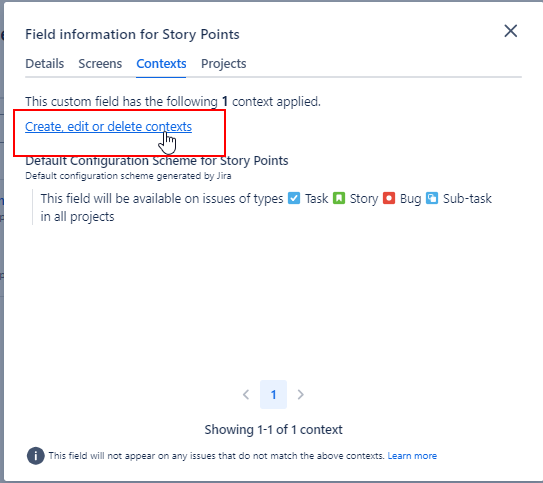
Once you've added an issue type in here you'll find you can update the “Story point" value on the backlog.
JIRA differentiates between company-managed and team-managed projects, each using a different field for story points.
“Story Points" for company-managed
“Story Point Estimate" for team-managed
Ensure you're using the correct fields for your project type. If you're in a Company managed project and you're using the “Story Point Estimate" field it won't have any affect on your Burndown chart. Best to remove the field from view so that no one uses it and avoid the confusion.
As you'll now be aware there's a lot of settings that will impact your burndown chart. Once you aware of all of these settings it'll make using the chart a lot more straight forward.
Now you have everything configured we need to work out what value to actually track on our burndown chart. As mentioned above you have 4 options:
Let's look at each of these in turn.
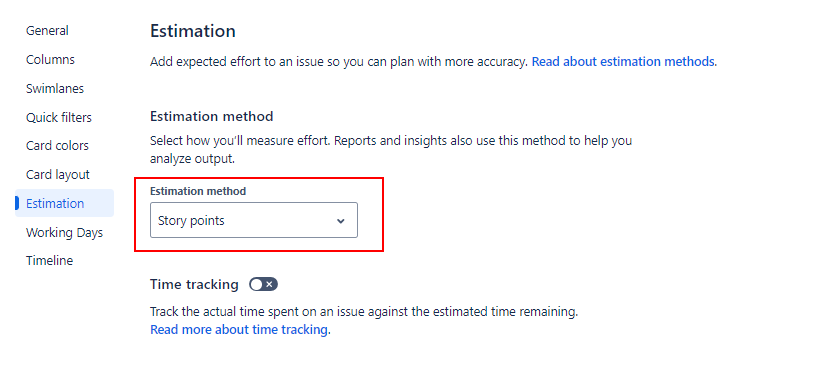
Active Sprint: Start a sprint with assigned story points to issues.
Board Configuration: Ensure the board is set to track story points.
Updating Status: Move issues through statuses (To Do, In Progress, Done) to reflect progress on the burndown chart.
Viewing the Chart: The chart shows the remaining story points versus time, updating as issues are completed.
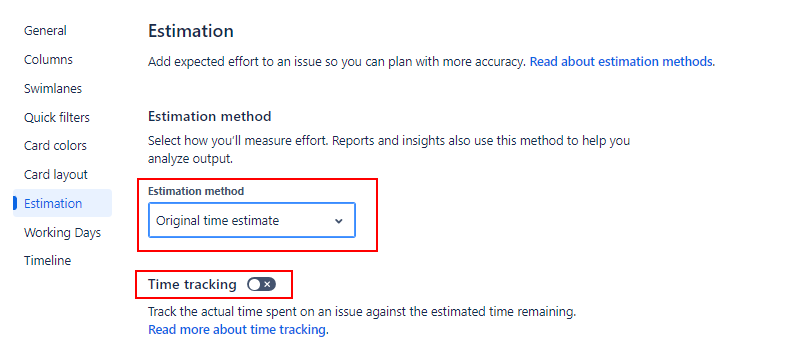
Board Setup: Set the estimation to “Original Time Estimate".
Time Estimates: Enter original time estimates for issues.
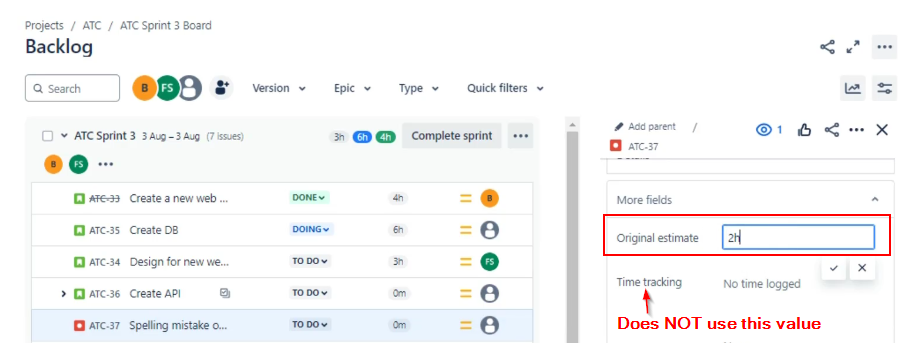
Progress Tracking: As issues transition to “Done", their estimated time is deducted from the total.
Viewing the Chart: The chart displays remaining estimated time, providing a clear view of progress.
Board Setup: Set the estimation method to “Original Time Estimate" AND…
Enable Time Tracking: Configure the board to use time tracking fields (Time Spent, Time Remaining).
Update Estimates: As work progresses, update the time spent and remaining estimates.
Viewing the Chart: The burndown chart reflects changes in the remaining time, offering a dynamic view of progress.
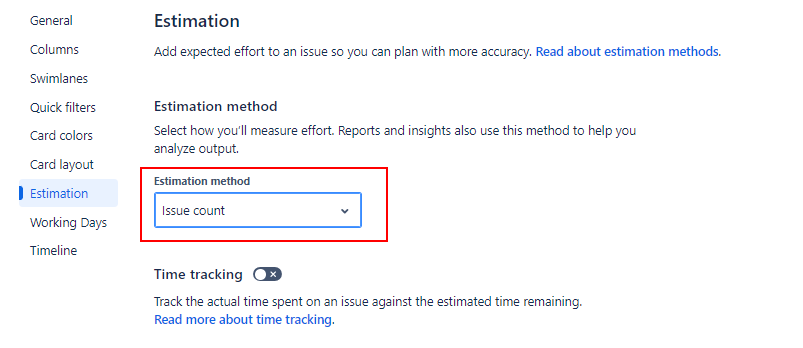
Board Setup: Set the estimation to “Issue Count".
Tracking Progress: Each issue transitioned to “Done" reduces the total count.
Viewing the Chart: The chart provides a straightforward count of remaining issues.
Mastering the burndown chart in JIRA allows teams to monitor their sprint progress effectively. By configuring the boards and understanding how different metrics (story points, time estimates, issue count) impact the chart, teams can ensure they stay on track to meet their goals.